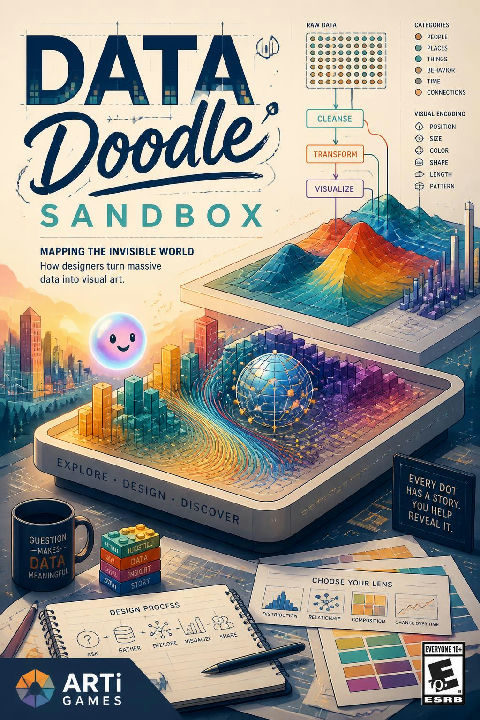
The pioneers of visual data
How our eyes read data
Mapping the invisible world
Living data and interactive art
YOUR GOAL
Master of The art of big data

choko Mapping the Invisible World
A thousand flights tracing lines in the dark, mapping the invisible skies.
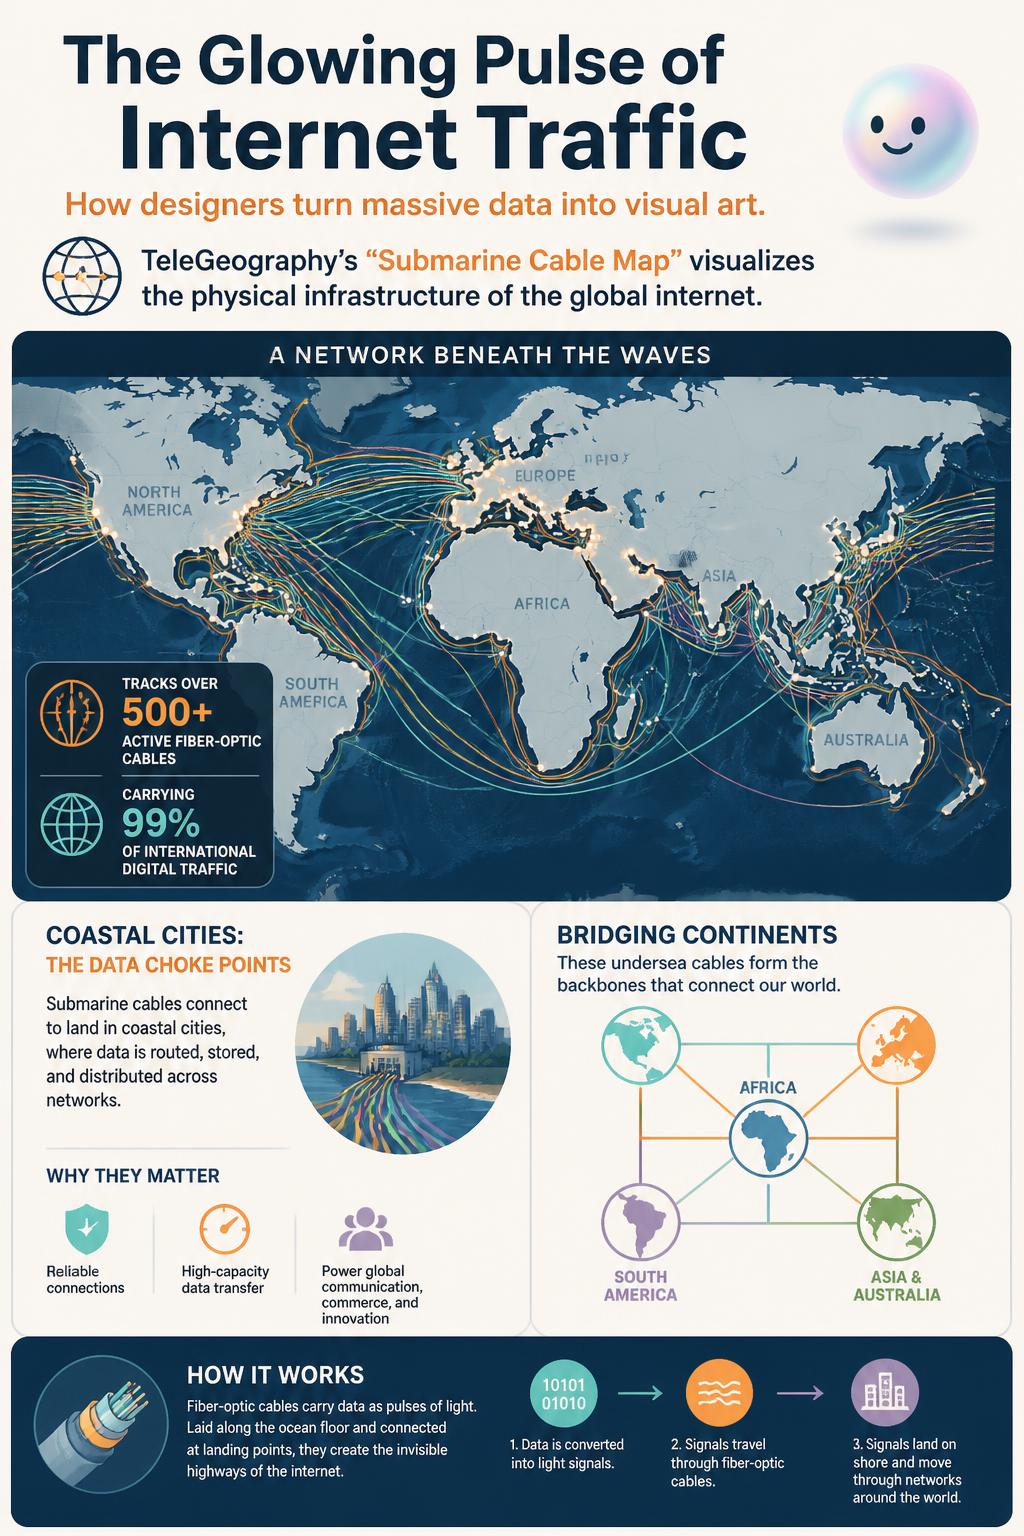
choko Mapping undersea fiber-optic cables reveals the physical skeleton of our digital world, showing how petabytes of data travel across oceans.
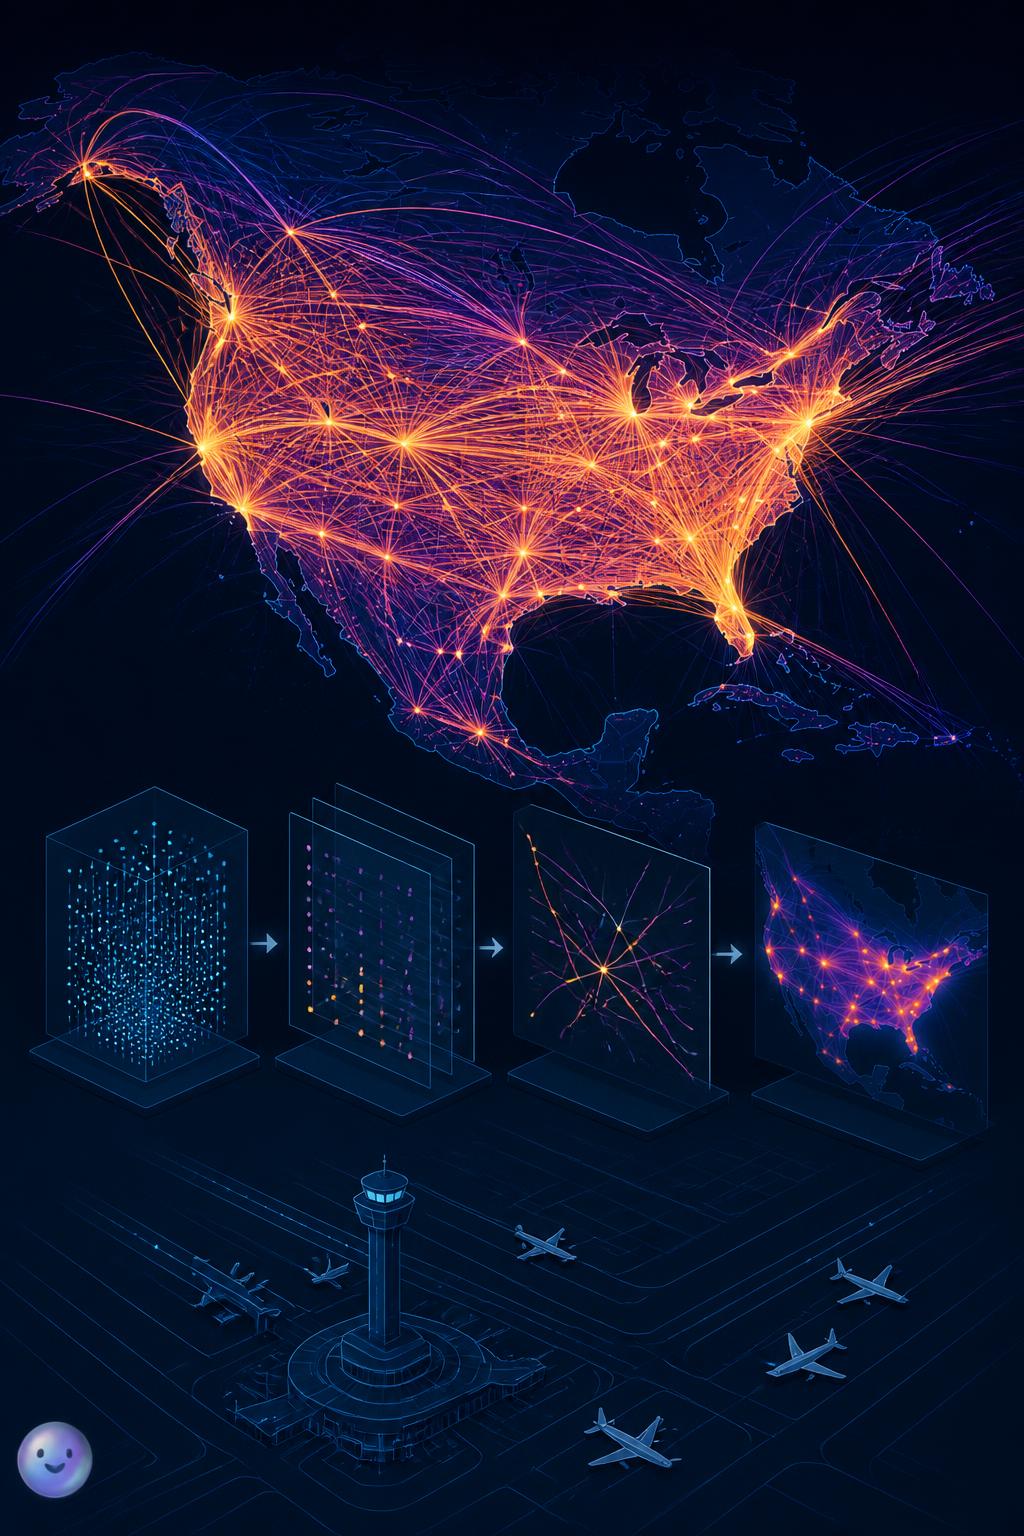
choko Aaron Koblin's "Flight Patterns" project processed flight telemetry data to reveal the invisible highways carved by airplanes in the sky.
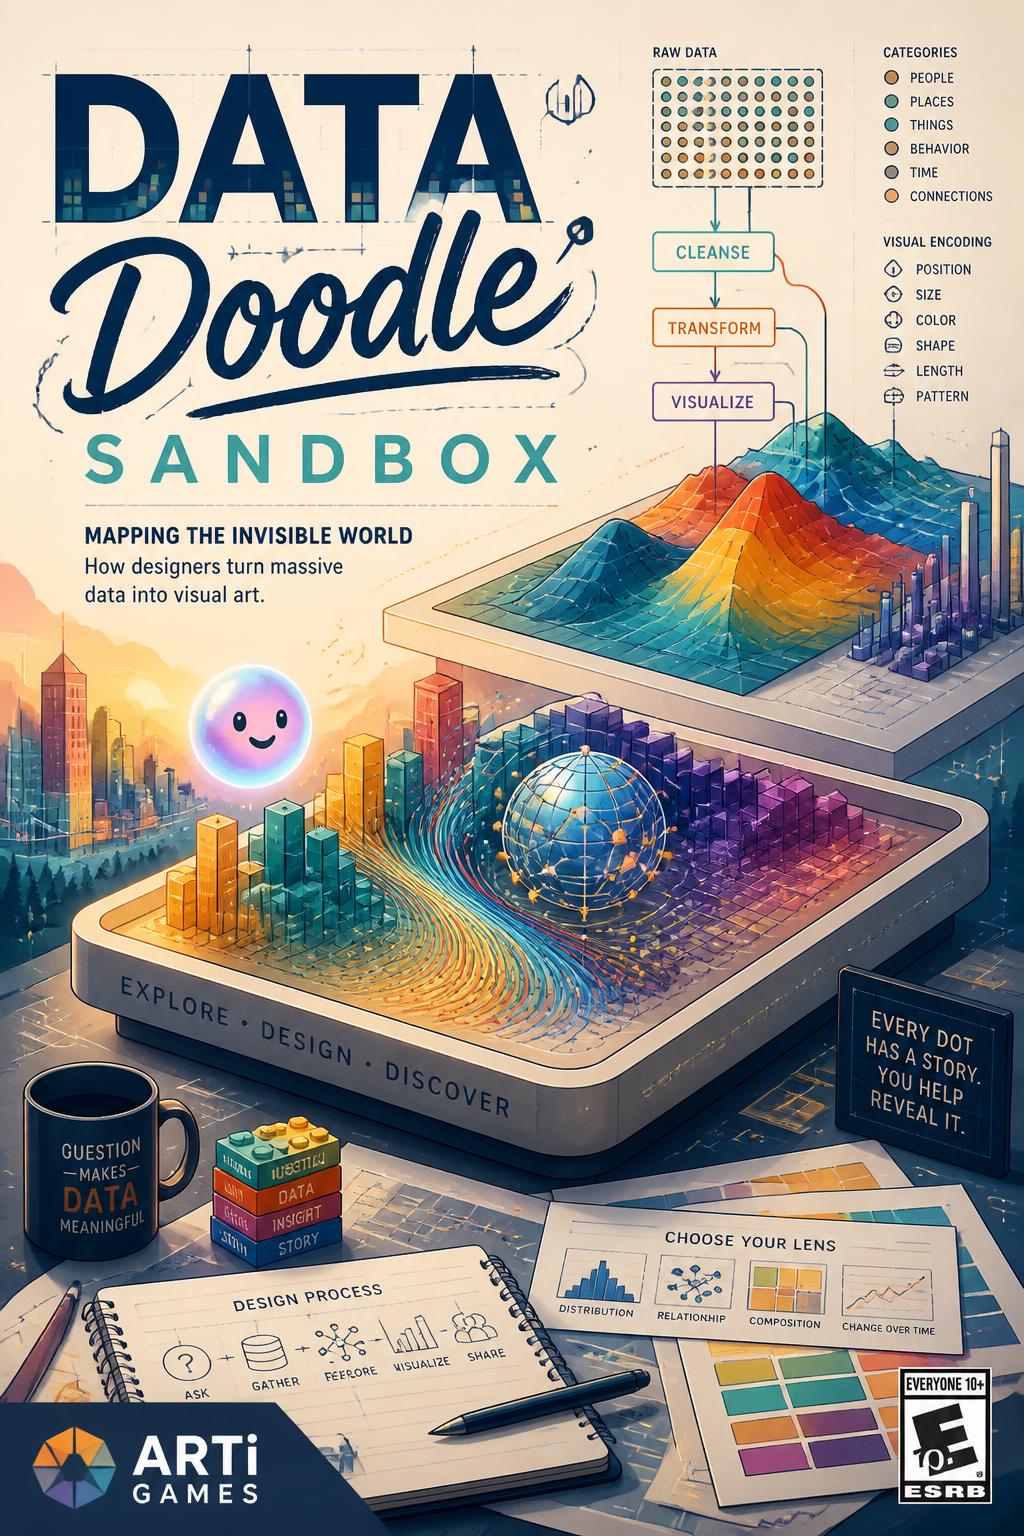
choko Doodle with raw numbers to learn how designers turn massive data into visual art.
Seabed mapping: Geologist Marie Tharp was barred from research ships in the 1950s, yet she hand-plotted sonar data to create the first comprehensive map of the ocean floor.
Why was geologist Marie Tharp kept off research ships while mapping the ocean floor in the 1950s?
What scientific theory did Marie Tharp's 1957 ocean floor map help prove to the scientific community?
How much of the world's international internet traffic travels through undersea cables shown on the Submarine Cable Map?
Which real-time data source did Fernanda Viégas and Martin Wattenberg use for their 2012 Wind Map?
What visual effect is created when thousands of individual flight lines overlap on a dark background?