
Chapter 1
The pioneers of visual data
Chapter 2
How our eyes read data
Chapter 3
Mapping the invisible world
Chapter 4
Living data and interactive art
YOUR GOAL
Master of The art of big data
Ch 2 · How our eyes read data

choko How Eyes Read Data
In just a quarter-second, before you even think, Your brain has grouped the colors in a fraction of a blink.
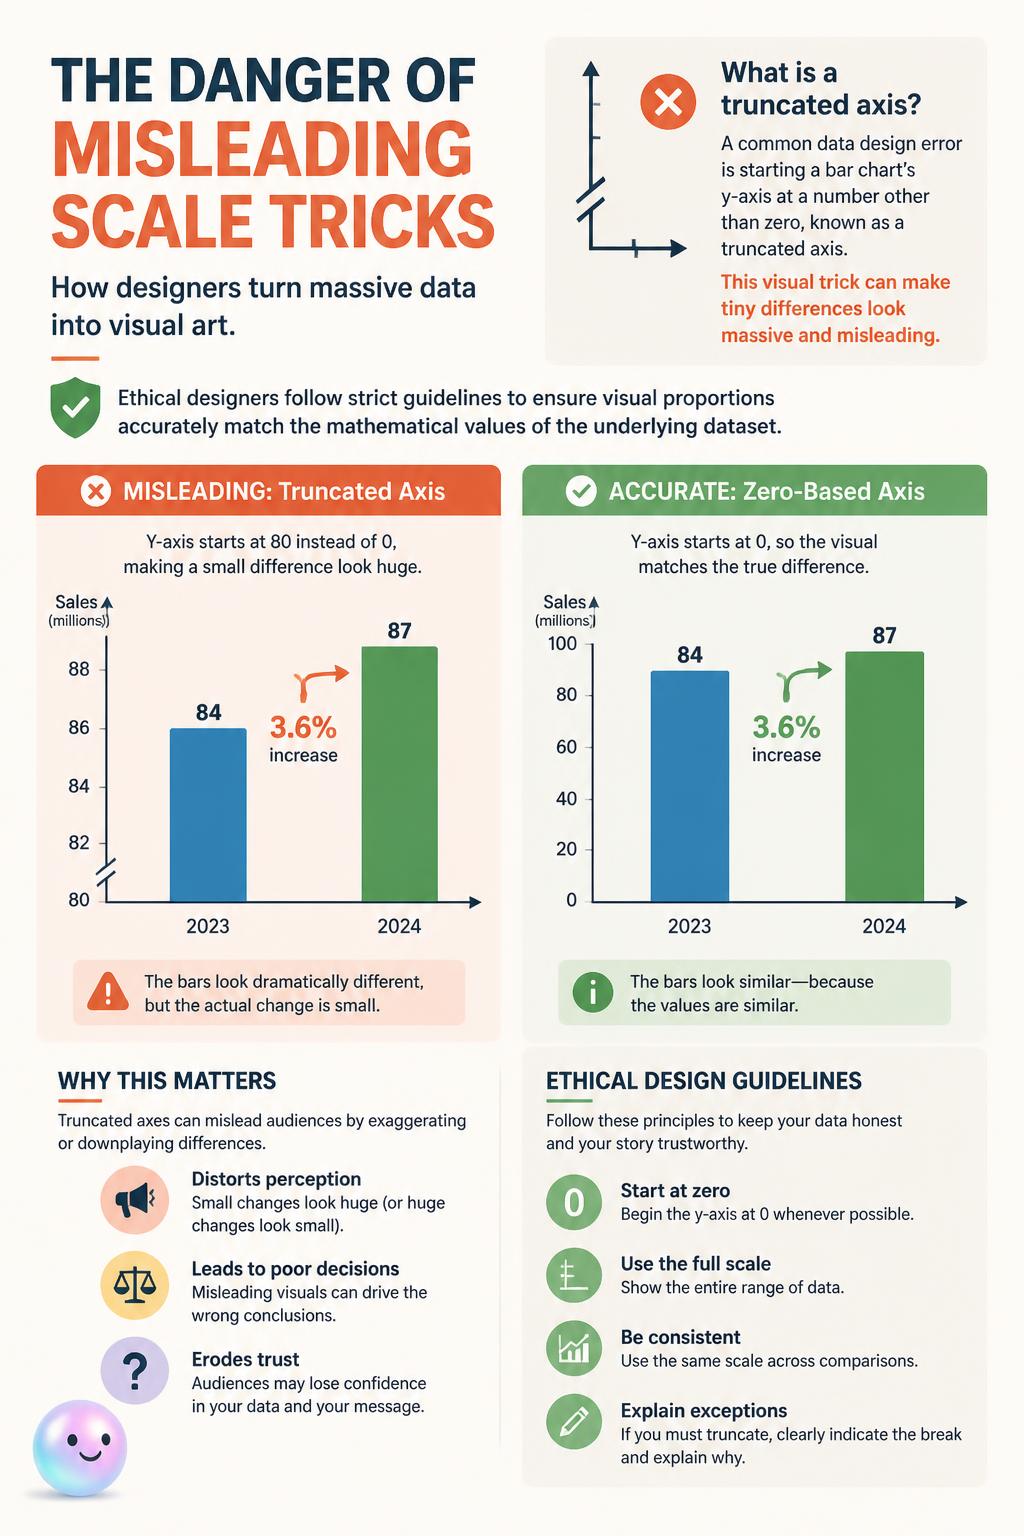
choko Truncating chart axes or manipulating scales can distort visual proportions and deceive viewers about the actual significance of data.

choko Color choices in data visualization can carry deep cultural meanings, sometimes meaning completely opposite things depending on the audience.

BETA
choko Play this interactive game to discover how our eyes read data and how designers transform massive datasets into stunning visual art.
Fun Fact
Quick thinking: The human brain can process basic visual attributes like color, size, and shape in under 250 milliseconds, long before conscious thought kicks in.
Quiz
How fast does the human brain process 'preattentive attributes' like color and size in a chart?
Quiz
What percentage of the male population is affected by red-green color blindness, a major design consideration?
Quiz
Which type of chart is generally considered the worst for comparing precise differences between many categories?
Quiz
What is the 'Lie Factor' in data visualization, a concept coined by theorist Edward Tufte?
Quiz
Which Gestalt law states that the human brain will naturally group data points that are placed close to one another?